Demographics of participating countries
Basic demographic data of individual partner countries where the WAM (Work Ability Management) project is implemented. Statistical and demographic data and grades (tables) were used from publicly available and official national statistical authorities, or European statistical and demographic studies (yearbooks).
Demographic situation and estimated trends in Europien countries
The aging of the workforce is a global phenomenon with significant implications for European countries. This fact has been caused in the last 50 years by an ever more perfect medical system, with the development of medical care from the prenatal phase to the late age of the individual. However, the aging process of the European population also means increased demands for prolonging its activity, also with the aim of its longer employment in the labor market. This requirement is in line with the ever-increasing life expectancy, ie the increase in life expectancy in virtually all parts of the EU. In 2005, only 42.3% of the 55- to 65-year-old workforce actively participated in worklife in the European Union. However the involvement in active worklife is still growing. In 2019, for which the latest data from the EU27 countries are available, 62.3% of the active population is already working.
However, the employment rate of older people varies significantly between European countries. While in the Netherlands and Germany it is already more than 70%, in Hungary and Slovakia it reaches only about 60%.
Important demographic indicators statistically processed by Eurostat for age management are population health indicators. Among these indicators, directly related to the support of aging people in the workplace, the most important are life expectancy (LE) and healthy life years (HLY). However, the HLY indicator is largely subjective, as it combines “hard” demographic data with answers to questions from questionnaire surveys conducted in small cohorts of European countries.
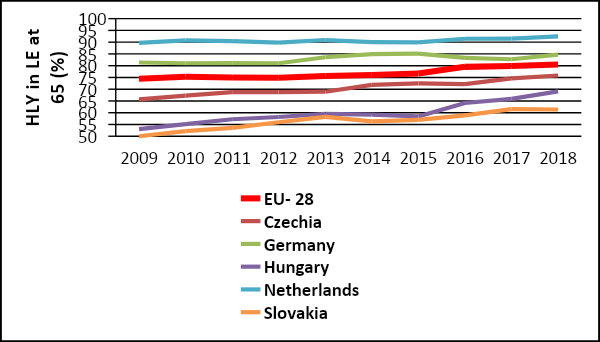
An important indicator is the ratio of the life expectancy of the population at the age of 65 (usually after reaching retirement age) to the total number of years of life of an equally old person. Expressed as a percentage over the last ten years, these values for the countries included in this project are shown in the following graph.
The figure shows that in the Netherlands, practically 9/10 of the remaining years of life are spent in a relatively healthy state, which allows it to carry out a wide range of personal and work activities. While in Hungary or Slovakia, the current population 65+ is limited for almost half of this time by diseases that more or less narrow its activities, i.e. the possible prolongation of its worklife.
HLY growth in project countries in the last decade

Demographic development in the Czech Republic
We base the evaluation of demographic development on the official yearbooks and data sources of the Czech Statistical Office (CSO). As of 31 December 2019, there were 10,693,939 inhabitants in the Czech Republic, of which 5,271,996 were men and 5,421,943 were women. For our needs, we present statistics from three important demographic groups. The first group is the age cohort of people 0–19 years, which numbers 2,188,232 people, then the economically-productive cohort of 20–64 years with 6,374,077 people, and finally the age cohort of people 65+ years, which numbered 2,131,630 people.
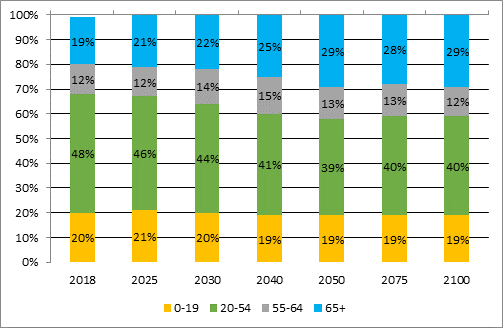
A multi-year view of the mutual percentage of the observed groups and its development with the projection of these groups until the end of the 21st century is shown in the following graph.
The demographic development of Czech society corresponds to the long-term trend of increasing the life expectancy of the population and the aging of the population throughout society. While in 2018 the percentage of the youngest age group 0–19 years was at the level of 20.5, the age group 20–64 years was 59.6 percent, and the age group 65+ reached 19.9 percent at the end of 2018, the demographic development of the Czech Republic expects a steady slow decline in the youngest group of the population (0–19 years) to values of around 19% of the population in 2100 with a further decline of the economically active group of 20–64 years to 52%. At the same time, this decrease will be due to the population aged 20–55, with a threatening 8% decrease in this cohort by the year 2100. There is also a noticeable increase in the oldest population, which is a full 10% by 2100.
In monitoring this demographic trend anticipated not only in the Czech Republic (this is an overall demographic shift in the aging of the population throughout the EU), it can be stated that significant changes, especially in the increase in the number of elderly people, should deepen further. As stated in the publication Age management: “According to moderate estimates, the number of people aged 15–64 will decrease from six to five million between 2040 and 2060, after a short stagnation to 4.25 million in the projection horizon. The biggest changes will undoubtedly occur in the senior category of 65 years and older.”
In the projection until the end of the 21st century, the proportion of the population over the age of 65 will continue to increase to values representing almost a third of the Czech population, while the proportion of its working subset will continue to decline to values representing only half of the Czech population.
Development of the age structure of the population of the Czech Republic
Source: Fukan, J., Labor Office of the Czech Republic, Contact Office Brno-město
The aging process of the Czech (but also European) population means increased demands for prolonging the activity of the population with the aim of longer employment on the labor market. This requirement is in line with the ever-increasing life expectancy, i.e. with the growth of the average life expectancy of the Czech population. The constant upward trend in the life expectancy of men and women in the Czech Republic over the last 50 years means that during the life of one generation, this indicator has increased by an incredible 10 years (69 years in 1970 and 79 years in 2018).
In relation to work ability, it appears to be the most important indicator of healthy life expectancy (HLY). In the EU as a whole, this indicator fluctuates over time and there is no significant upward trend.
For the Czech Republic, it first increased by a total of 5 years in 2005–2014, which exceeded the EU average, and then fell by about 2 years in 2014–2017.
In the last decade, the average life expectancy in good health at birth is 78.1 years and the life expectancy in good health is almost 63 years, which means that HLY already makes up 80% of the estimated life expectancy at birth.
In terms of the possible prolongation of the active life of the population over the age of 65, i.e. the population that has reached retirement age in today’s legislative perspective, data on their proportion of life spent in good health is very interesting. This population will already live for an average of almost 18 years, with a full 12.5 years in relative health, which at this age makes up a respectable 70.6% of the estimated life expectancy.
It is gratifying that for both of the above-mentioned populations, a faster increase in this share can be observed in recent years, which means that the number of years over the generation over the age of 65 that will be able to live in health is increasing.
Demographic development in Hungary
In Hungary, as in other European countries, aging population poses a number of new policy challenges to employment, working conditions, living standards, health and well-being. At the same time, this trend also reflects a positive aspect of social change and the importance of active aging. Since the monetary crisis of 2009, in the accelerating economic competition, and in the transformed labour market, which shows a significant increase in demand, workers and jobseekers who belong to older age groups continue to be part of the vulnerable, disadvantaged population. Assisting their employability, maintaining their work ability, motivating their rehabilitation and their return to work can be crucial for both society and the economy.
Population size and expected development
The population of Hungary shows a continuously decreasing trend, in 2019 the population was 9,772,756 (9,769,529 in January 2020). Compared to the last ten years, we have experienced a loss of more than 200,000 people. The determining factor of population decline is natural decline, including a decrease in birth rate.
Average life expectancy at birth has shown a slowly increasing trend over the last decade, with 72.86 years for men and 79.33 years for women in 2019.
17.1% of the total population is over the age of 65, the aging index is 132.5, and the dependency rate of the elderly population is 30.3%. Population decline is not expected to stop, various model calculations put the expected population size between 8 and 9 million in 2050.
In particular, the basic model puts the expected number of the Hungarian population at 8.44 million, assuming a population decline of about one and a half million. This represents an accelerating population decline compared to the previous period. The projected population decline until 2050 may also bring significant change in the age composition of Hungary’s population. According to the basic calculation, the absolute number of the young (0–14 years) and working age (15–64 years) population will fall to 70–75% of its 2011 value, while the absolute number of those over 65 will increase 1.5 times.
According to the results of the latest forecast of 2018 by the Population Research Institute of the Hungarian Central Statistical Office, the population of Hungary is expected to be 7,750,000 in 2070 in the basic version, the high version indicates a population of 9 million and 70,000, the low version indicates 6 million [12]. In 2019 the Central Administration of National Pension Insurance paid pensions (old-age, widow’s, parental pension, orphan’s benefit) or some other benefits (age-based benefits, benefits for the disabled, other annuities, emoluments) to more than a quarter of the population, 2.6 million people.
Aging is associated with deteriorating health in the case of many individuals; therefore, it is important to look at the number of people with permanent disabilities within the population. According to a survey conducted by the Hungarian Central Statistical Office in 2016, the number of citizens with disabilities and hindered due to health reasons is significant in the population. During the survey period, the number of disabled people was 408 thousand and their share in the population was 4.3%. The number of impaired persons due to self-declared (subjective) health reasons is significantly higher. According to the micro census, the estimated number of people in the total population who felt hindered due to their health in everyday life was 1,489,000, representing 16% of the total population. Regarding age groups, almost one-fifth of those aged 40-49 already consider themselves impaired. Over the age of 50, their proportion is growing rapidly, and the majority in the 60-year-old and older population is already impaired.
Employment situation of the aging population
Labour market conditions have changed in both Europe and Hungary, as the supply-driven labour market has been replaced by a demand-oriented labour market, the reasons behind this shift include globalization, the process of mobility and the appreciation of knowledge. The increase in the demand for labour over the past decade has come at a time when labour resources have been steadily shrinking for example due to demographic reasons.
Large age groups born in the first half of the 1950s are now exiting the labour market en masse and much smaller age groups born in the 1990s are entering it. In 2020, the working-age population aged 15–64 years included only 6 million 274 thousand persons, a decrease of 159 thousand compared to a 2008 assessment (6 million 433 thousand persons). The labour market consequences of the unfavourable demographic process can still be partially offset until 2022 by gradually increasing in the retirement age, even if women (under certain conditions) can retire earlier than their regular retirement age.
According to the data of the workforce survey in the fourth quarter of 2019, the number of employed persons in the population aged 15–74 was 4,520,000, and compared to the
15–64 age group, their employment rate was 70.1%. The employment rate of young people aged 15–24 fell by 0.5 percentage points to 28.5%, while that of those aged 55 and over rose significantly.
In 2019 the changes in the contribution payments had a positive effect on the employment of retired people: they only have to pay the personal income tax of 15% and are exempt from paying other contributions.
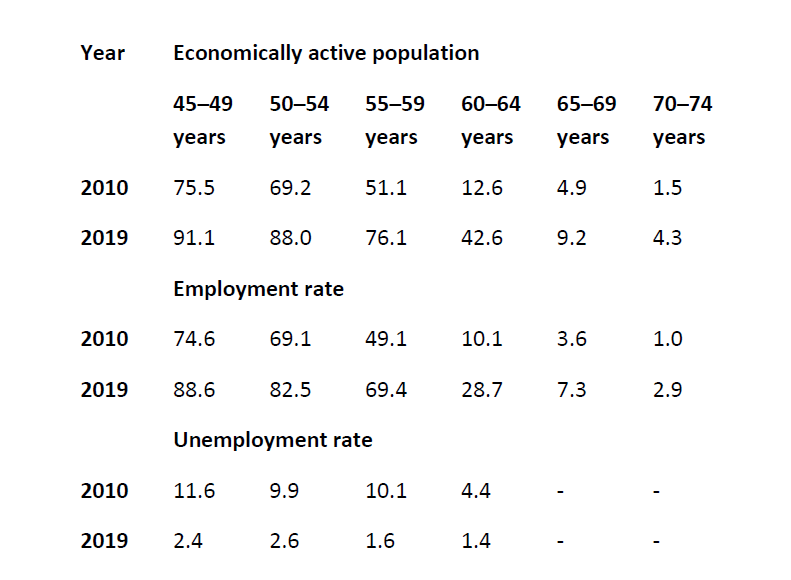
Looking at the trends between 2010 and 2019 in terms of labour market status relative to the total population we can find that the proportion of the aging and older age groups has increased within the numerically declining economically active population. On the one hand, due to the already mentioned retirement age and, on the other hand, due to the increase in labour demand. We should further consider that the number of people missing from the workforce as a result of emigration and foreign employment also generated demand. The same applies to the rising employment rates and declining unemployment (see Table 1).
Labour market status ratio for age groups 45-74 (%)
Source: Hungarian Central Statistical Office
According to the data of the Hungarian Central Statistical Office for the second quarter of 2020, the number of the economically active population aged 15–74 was 4,622.4 thousand, thus, the activity rate was 62.4 %.Out of the active population, 4,408.2 thousand were employed and the number of unemployed was 214.1 thousand.
In the second quarter of 2020, the employment rate of the population aged 15–74 was 59.5%, according to the Hungarian Central Statistical Office. The average closing day number of jobseekers registered by the Hungarian National Employment Service was 356.8 thousand, which is a significant increase compared to the previous quarters due to the COVID-19 pandemic.
The number of jobseekers belonging to the 45–55 age group was 60,900 (21.1%) and the number of people aged 55 and over was 74.7 thousand (25.7%). In practice, 46.8% of jobseekers belong to sensitive age groups. It is important to highlight that latent employment (job search) is higher than what was mentioned above; one reason behind this is public assistance. The duration of job search assistance in Hungary is 3 months, the lowest in Europe. In December 2020, 149.9 thousand jobseekers were entitled to cash benefits and 47.8% received social benefits. 48.4% of jobseekers did not receive any financial support in the examined month.
Demographic development in Germany
At the end of 2019, about 83 million people were living in Germany, 72.8 million of them held the German citizenship and 10.4 million were foreign citizens. The number of female persons was slightly over-proportional amounting to approx. 51 %. The average age of the population was 44.5 years.
The economy was characterized by approx. 3.6 million companies, the majority (approximately 97%) being small and medium-sized enterprises (SMEs). As of 2019, Germany had a labour force potential of 46.5 million persons with a total workforce of 41 million persons employed, among them 33.8 million employees (15 million females) subject to social security contributions.
Germany is in the midst of demographic change. The increasing number of older people and the simultaneously decreasing number of people of younger age cause an unprecedented shift in the demographic framework. Today, every second person in Germany is older than 45 years and every fifth person is older than 66 years.
After many years of decline, birth rates have been rising slightly since 2012, but they remain nevertheless much lower than the replacement rate of a stable population. On the other hand, Germany has experienced unusually large-scale immigration in recent years, especially of young people. This trend, however, has slowed down significantly as of 2019.
A comparison of age structures within the last hundred years shows the progress of demographic change. The cohorts with high birth rates from 1955 to 1970 (the so-called baby boom generation) form the largest age group. By now this group has reached a certain age and will retire completely from the labour force within the next two decades. The number of people aged 70-plus rose from 8 to 13 million between 1990 and 2019. In 2018, the baby boomers of the 1950s to 1960s, as well as the consequences of declining birth rates due to changes in lifestyles and contraceptive measures (the so-called “pill kink”) were noticeable.
The projections up to 2060 show an increase in the proportion of people older than 70 and a significant reduction in the working-age population. The birth rate will not increase significantly – and this “dejuvenation” trend of society will continue as children who are not born today cannot have children themselves tomorrow.
The projections show that these processes cannot be stopped despite a relatively wide range of assumptions about the future development of demography influencing factors such as birth rate, life expectancy and net immigration. The current age structure predicts a decline in the working-age population and an increase in the number of senior citizens within the next 20 years. In 2018, there were 51.8 million people of working age between 20 and 66 years in Germany. By 2035, the working-age population will have shrunken by around 4 to 6 million persons to 45.8 to 47.4 million. Afterwards, it will initially stabilise and then fall to 40 to 46 million by 2060, depending on the level of net immigration. Without net immigration, the working-age population would already decrease by around 9 million persons by 2035.
The number of people aged 67-plus has already increased by 54% between 1990 and 2018, from 10.4 million to 15.9 million. It will grow by another 5 to 6 million to at least 21 million by 2039 and will then remain relatively stable until 2060.
Regional differences will continue to increase until 2060. Assuming a moderate development of birth rates, life expectancy and net immigration, the population will decrease by 4% in the western and by 18% in the eastern German rural regions. In the cities, on the other hand, it will grow by 10%.
The working-age population between 20 and 66 years will decrease in all federal states. Between 2018 and 2060, under the same conditions, the number of persons of working age will fall by 16% in the western and by 30% in the eastern German rural regions and by 4% in the cities.
- an increase in the overall employment rate, especially for those aged 55-plus and for women,
- increased recruitment efforts in the domestic market and internationally,
- offering attractive working conditions with opportunities for professional and personal development,
- technical and organisational adjustments and innovations to provide marketable production and services with fewer employees.
- The proportion of older people in the workforces of companies and administrations will continue to grow significantly in the coming years. The large group of baby boomers is collectively “moving” through working life. For the increasing number of employees aged 50-plus it is a matter of urgency that work is designed to be age- and ageing-appropriate.
- At the same time, the decreasing number of junior staff is already tangible and this trend will continue. This will lead to intensified competition for apprentices and university graduates.
The collective ageing of the baby boomers on the one hand and the significantly smaller number of working-age people in the following generations on the other hand, lead to a shift in the ratio of employed to non-employed persons. It is projected that the relation will change from 4:1 to 2:1, meaning that only two instead of currently four working people will have to generate the funds for transfer payments to non-working people.
- Increasing the labour force participation rate, especially of older people and women,
- with a simultaneous extension of working life (earlier entry into working life and later entry into retirement or pension).
- have a job (employability),
- are able to stay longer and well in work (work ability), and
- are able, willing and allowed to carry out work productively and well (work well-being).
To achieve this, employability needs to be improved to become a good fit between people’s capacities and work requirements. Promoting work ability is therefore on the agenda of individuals and organisations.
What is needed is a design of work that is attractive to younger and older people and provides enough flexibility for a good balance between work and private life.
Age- and ageing-appropriate work should take personal capacities and individual needs as well as changes in work requirements into account.
These factors change in the course of (working) life. It is therefore the task of companies, organisations, departments and employees to adapt the conditions soon in line with requirements, so that the work ability can be maintained over the entire course of one’s career and productivity is ensured.
Prerequisites for this are in particular:
- a mindful and appreciative personnel policy,
- age- and ageing-appropriate career paths that are aligned with life phases, and
- working conditions that promote health and personal development.
Reports on the situation of the older generation in the Federal Republic of Germany are prepared and published by a commission on behalf of the Federal Government in every legislative period since 1993. The aim is to provide continuous support for decision-making processes in the field of old-age policy.

Demographic development in Slovakia
The global population ageing, which has been observable for several decades, is fully present in Slovakia as well. We can classify the European Union, of which Slovakia is also a member, as one of the ageing world powers. However, the EU is not a homogeneous entity and we can see national differences in terms of the population age composition, and the dynamics of population ageing. The ranking of individual countries with the oldest population changes all the time. Countries will change their rank depending on the ageing of their significant age cohorts (onset, culmination and progress of population ageing). The most elderly populations, currently led by Sweden, will gradually be replaced by countries such as Portugal, Greece and Spain around the year 2050, and should the not so encouraging forecasts be fulfilled, Slovakia might come to the forefront around the year 2080.
According to the Eurostat EUROPOP 2013 forecast, the share of the elderly population in the EU 28 should increase from today's 18,2 % to 28,1 % by the year 2050 (of which 10,9 % will constitute people over 80, doubling their representation) and to 28,7 % by the year 2080 (of which 12,3 % will be people 80+). As we can seen, the forecast predicts a degree of stabilisation in the development of the population age structure after 2050; the largest inter-decade increase in the proportion of the elderly population should occur between 2020 and 2030, when the dynamics of the increase of the elderly population proportion should culminate (an increase of 3,5 pp).
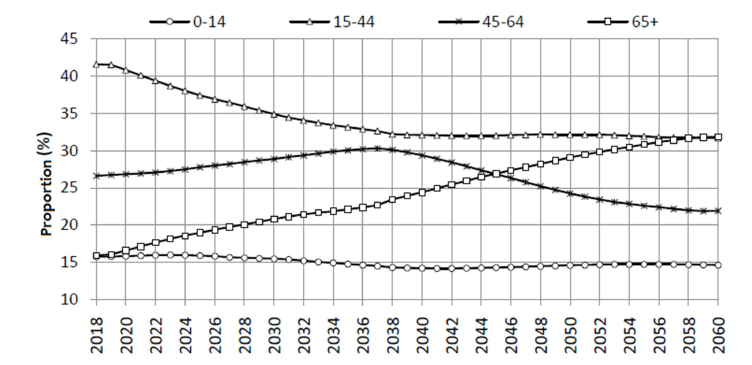
The main demographic trends in Slovakia by 2060 is a decline in the population, with a high likelihood of happening, and intensive population ageing, which will be irreversible in the next decades. The productive population can expect a dramatic decline by 2060, while the post-productive population, on the contrary, a dramatic increase. In the period of 2017–2060, the number of people aged 15–64 will decrease by approximately 970 thousand, and the number of elderly aged 65 and over will increase by about 760 thousand, or 86 %.
The forecast of the development of the main age group proportions in the population of Slovakia by 2060
Source: Infostat
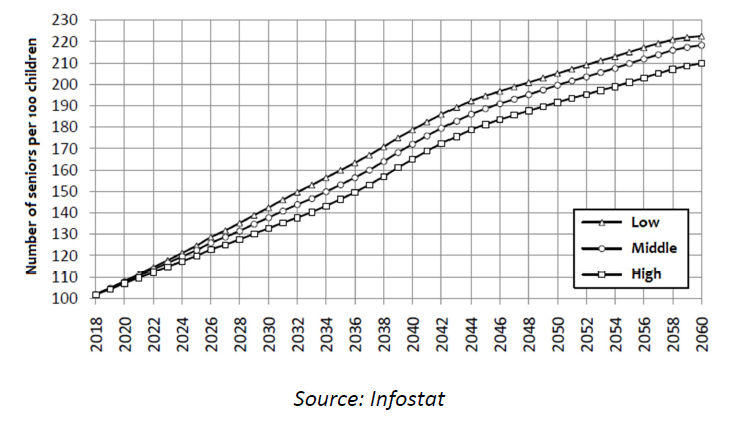
These changes are also markedly reflected in the ageing index, also known as the Sauvy index, which directly quantifies the process of population ageing. It represents the number of people in post-productive age per 100 people in the pre-productive age. Slovakia is among the countries with the most dynamic change in the ageing index.
While in 2011 we had been among the countries with the largest population in pre-productive age in relation to post-productive age (ratio: 100/80), in 2020 we were already at the level of 100/108,13. In 2060, we can expect to be leading the countries with the worst ageing index (ratio 100/220), showing more than double the increase compared to 2020.
The ageing index is the best indicator of the necessity and relevance of the topic of age management, as well as the management of the ageing population’s ability to work itself.
Forecast of the ageing index development in Slovakia by 2060
Source: Infostat
“Life expectancy at birth in 2017 was 77,3 years, an increase of four years compared to 2000, but still almost four years lower than the EU average (80,9 years).”
The number of healthy life years is an indicator that fundamentally defines the quality of life in old age. According to the 2017 SHARE survey from the Eurostat databases, Slovakia lags significantly behind the EU average healthy life years at the age of 65. Slovakia: out of an average of 17,4 years, we are expected to live only 3,9 years in good health and 13,5 years in illness, compared to the European Union average: out of 19,9 years, 10 years in good health and 9,9 in illness.

Demographic development in the Netherlands
In the Netherlands the composition of the working population has changed drastically in the past twenty years and ageing of the working population is one of these changes. Ageing of the working population is the result of the increased life expectancies and declining fertility rates. Ageing is not the only important change that occurred on the labour market and in the labour relations in the Netherlands. Other developments are the flexibilization of working relations, the rapid increase of self-employed which is especially strong in the Netherlands and also the impact of robotisation and globalisation. The picture is complex and sometimes contradictorily: shortages in many sectors of skilled employees in contrast to rising unemployment in other parts of the labour market. Some speak of a silent revolution that is taking place on the labour market in the last decades. A silent revolution that will radically transform labour relations and the labour market in the coming years, but also the way we work and what kind of professions that will survive the impact of robotics on how we work. All these ‘big’ trends influence directly and indirectly the individual relations between employer and employees and the challenges they face. The picture is complicated. On the one hand, professions will disappear and / or task packages will change drastically, on the other hand, new technology will enable employees with disabilities to work and remain productive.
And these developments are international developments: all industrialized countries are confronted with the impact these developments. What are the main developments and challenges in and for the Netherlands?
Demography: the Dutch labour force
The demographic challenge: ageing and declining fertility rates. As a result, there are more elder persons and fewer younger persons to replace them. For employers this ageing of the population is a challenge: how to retain older workers? How to keep them fit and motivated? How to design on workplace to improve the working conditions! But not only for employees ageing is a problem. It also results on more pressure on the welfare system especially the pension system in the Netherlands.
Ageing has taken different forms. When we look at the average age of the population between 2000–2020 there is an increase of four years. Based on the calculations of the national statistical bureau (Centraal Bureau van de Statistiek, CBS), the average age of the Dutch population was in 2000 38,2 years. In 2010 this number has risen to 40,1 and in 2020 the average age of the Dutch population was 42,2 years.
When we focus on the labour force the increase is even stronger. The CBS has calculated that the so-called grey-pressure, (the ratio between the number of persons of 65+ and the number of persons between 20 and 65 years of age) has risen from 21,9% in 2000 to 33,1% in 2020. So, the number of older ‘inactive’ persons is clearly increasing, and the number of potential employees is relatively decreasing.
These decreasing number of employees are increasingly older. In 2003 22,0% of the total working population was 55 years of age or older (866.000 persons). In 2010 this number had increased to 1.341.00 employees: 29,2% of the total working population. In 2019 more than 35% of the total working population was 55 or older 1.977.000 persons of 55 years and older.
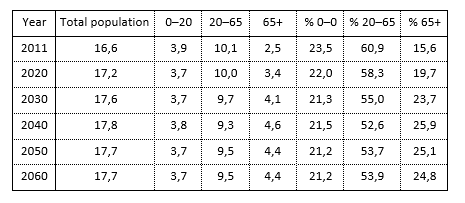
In the long-term ageing will stabilize as chart 1 shows but for the coming years ageing will grow and remain a big question for both employers and employees how to keep fit and productive for as we now, also form the research on the work ability most research shows a significant relation between ageing and workability: Age is one of the three factors that correlates with work ability in the sense with the growing of the years the work ability decreases.
The impact of the ageing workforce on the labour market will become clear in the next period of twenty years, a period of transition when also a great number of the so-called baby-boomers will leave the labour market and go with retirement. After 2035 when this shift has been completed the expectation is that no great shifts will occur.
Population forecast in the Netherlands, 2010-2060
Source: Kerncijfers van de bevolkingsprognose 2010-2060 CBS. *: x 1 million
Ageing is a European challenge. In the Netherlands, compared to other European countries ageing seems to be relatively mild. The challenges in other countries for example Germany are much bigger.
The challenge for society is rising costs of retirement and productivity loss as a result of labour shortages and a decreasing work ability. To cope with these challenges the Dutch government and social partners have taken measures to change de pension system, increasing the mandatory retirement age and discouraging early exit from the labour market. The aim is to increase employees to work until a later age.
The impact of ageing is closely connected with other developments on the labour market. For instance, the impact of globalization and robotization on the possibilities of employers to redirect production processes, new jobs that are a result of robotization but also the disappearance of jobs and the replacement by computers and robots. So, there is no linear connection between ageing and for instance labour shortages or the strategies that employers can use to tackle the impact of ageing.


